Building a GPS for disease biology
Unravel and discover hidden connections using the BioBox Graph Explorer
Introduction
Biomedical data is highly fragmented. Just for describing genes alone there are at least 3 major systems for identifiers (e.g. Ensembl, Refseq, Entrez). There are countless concurrent efforts in ontology development, dataset harmonization, and public knowledge base creation. Together, they provide the context that scientists use to interpret data. However, in practice, whether you start with literature, or go right to the source data, at some point in your journey you’re going to end up with 100 browser tabs open trying to connect the dots together.
It’s not you, its the data.
To solve this, BioBox developed the Graph Explorer. An interactive application to traverse your custom knowledge graph, just like a map, and develop a GPS for understanding disease biology.
BioBox Graph Explorer
The Graph Explorer is an ontology-aware application that allows scientists to:
Discover Hidden Connections: Dive deep into the interrelationships between real-world data objects. Whether you're linking genes to diseases or phenotypes to pathways, the Graph Explorer reveals patterns that are crucial for breakthrough discoveries.
Enhanced Data Mining Capabilities: Leverage advanced algorithms such as A*, Dijkstra’s, PageRank, and k-means to navigate and dissect complex data structures. Whether you're finding the shortest paths between two indications of interest or identifying significant gene regulators within your interaction network, our tool simplifies these tasks, making them more accessible and actionable.
Collaborative Exploration: Share your findings effortlessly with colleagues. The Graph Explorer allows you to save and share exploration sessions, ensuring that your team builds on collective knowledge and biological insights, fostering a collaborative research environment.
Navigate Through Information Quickly
Hours of valuable research time are wasted trying to figure out how data is connected and sifting through endless webpages and databases. The graph explorer centralizes all these disparate data sources into a singular view.
Load in an object from your data graph and instantly see all the connections associated with it. Importantly, relationships have semantic value and convey a meaningful association between two real-world objects.
For example, in a gene-centric view, starting with KLF4:
You can select one or more nodes by clicking or brush selecting. Active nodes in your selection will display a data card that lists out all data properties annotated on the node. The relationships panel lists the known edges connecting to KLF4 where:
the direction of the arrow indicating the orientation of the connection
the badge label representing the Concept associated with the connected object through that relationship, and
the number in parentheses indicating the quantity of distinct edges of that type.
Exploring Data Connections
Each relationship is backed by either a curated assertion (e.g. from a known ontology) or extracted from a data source. These data sources can be internal proprietary datasets or from literature and public data. In this graph, we’ve loaded in Locus2Gene scores from Open Targets Genetics portal and transformed them into VariantAssociation hyper nodes. By expanding the “has association” edges, we can instantly load in GWAS inferred associations between traits/diseases and KLF4.
Through the directionality and differences in edge types, we can model biological complexity directly in the graph topology. Adding in additional styling helps to visually distinguish these patterns.
Zoom out to see the bigger picture
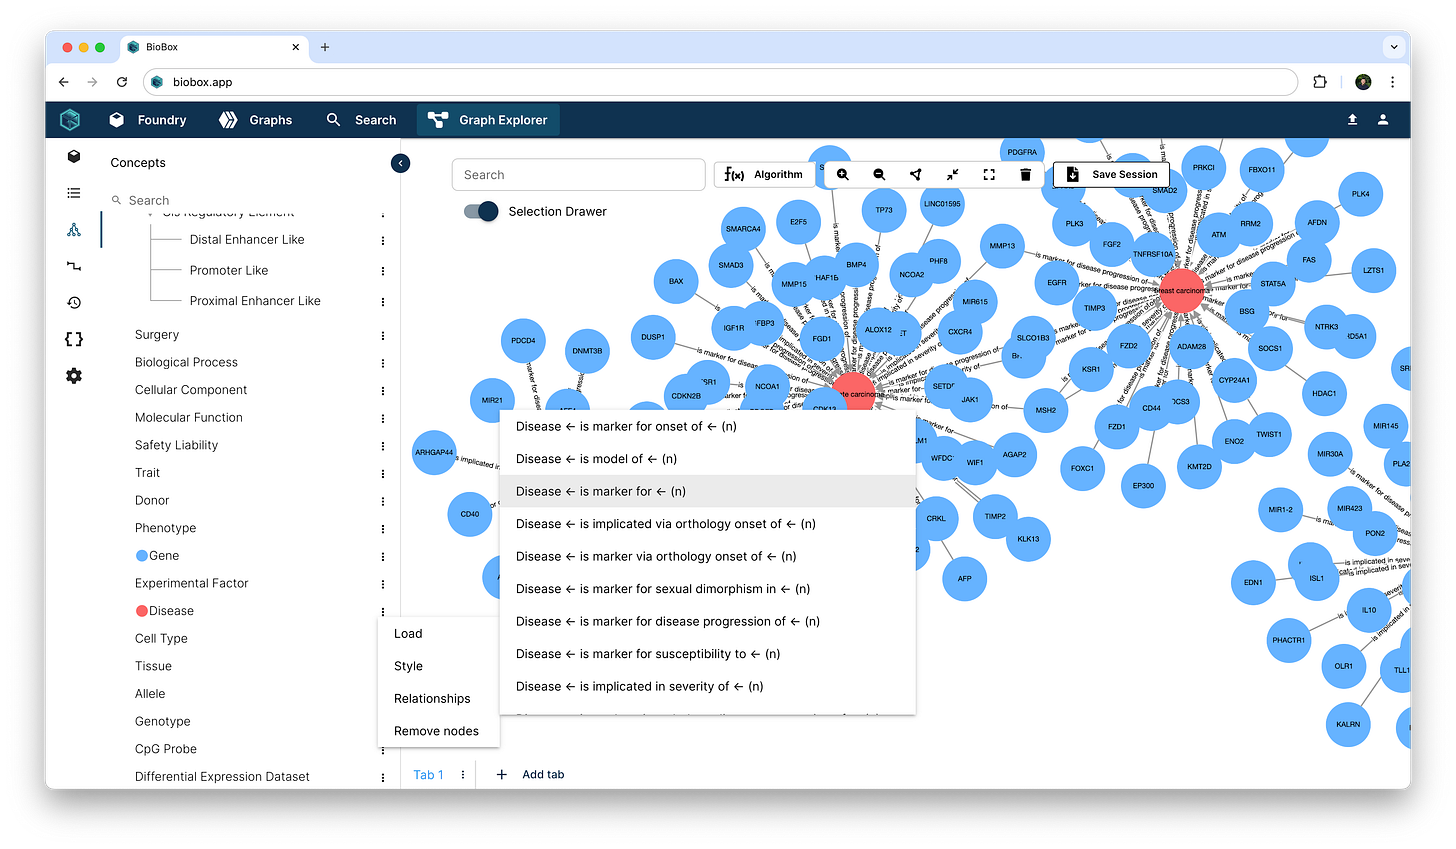
As we start to walk through the data graph, we can ramp up the data exploration space by expanding all relationships at a Concept level. In our KLF4 example, now that we’ve found some Disease connections through GWAS linkages, we can load in all known disease markers into the canvas.
Next, we can connect the Gene nodes in the canvas through the “activates” edge to reveal a sub-network of gene regulatory interactions.
Run graph algorithms
At this point, the graph is dense, and what we’ve systematically done is the following logic:
Starting with KLF4
Find some GWAS associations between KLF4 and diseases
For those diseases, find all the gene markers
For all gene markers, connect their activation regulatory patterns
While it is difficult for us to reason over the graph visually, they are the perfect substrate for graph algorithms that can yield interesting data-driven insights. For example, now that we’ve loaded in a gene subnetwork from a given context, we can run community detection algorithms like PageRank to score and detect highly influential genes, with the click of a button!
Sharing a biological narrative
You can take a snapshot of your current session that captures the data, styling, and results of your analysis so that you can continue working on it later, or perhaps, share it with a colleague. There are no limits to how many sessions can be saved, and that means you have an infinite canvas and the tools to paint your biological narrative and share it with your team.
About BioBox
BioBox is a data intelligence platform for drug discovery. Rapidly build a custom data graph and deploy graph ML models for target prioritization, indication selection, and MOA analysis. Teams using BioBox make faster and better data driven decisions to de-risk drug programs and get assets into clinical studies quicker.
To learn more about how BioBox can supercharge your discovery pipeline, book a demo with one of our team members!


